Froome told
to the world that his victory in the Tour de France will withstand the test of
time. To the many people who still have doubts about this, I propose to
examine closely a detailed analysis and comparison of the performances of
Froome, Contador and Indurain.
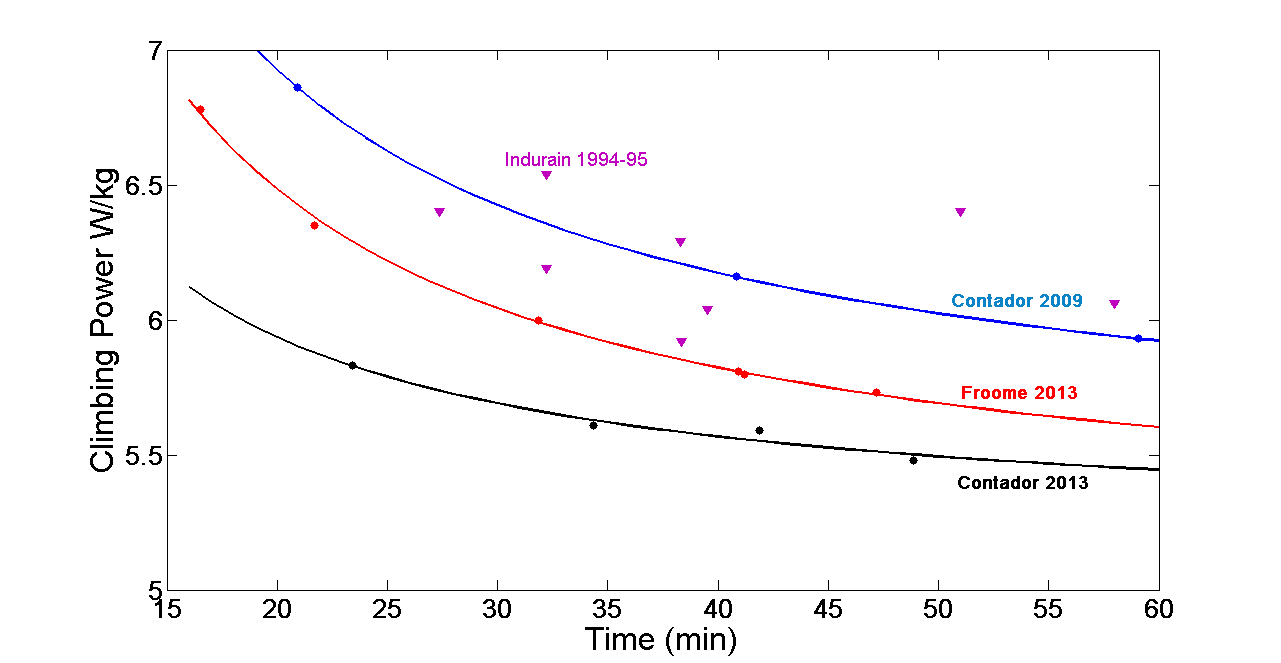
The graphics at the left (click for larger picture) shows the climbing time on the horizontal axis and the corresponding
climbing power, in Watt per kilogram, of their performances in relevant final climbs.
Where did
these data come from? Froome 2013 and Contador 2013 are my own computations.
Contador 2009 and Indurain 1994-95 are historical data by Mr. Vayer and Mr.
Portoleau. For the red Froome-data and the black Contador-data I used the final
climbs on AX 3 Domaines, Mont Ventoux, Alpe dHuez and Annecy-Semnoz. For
Froome also the data from La Planche des Belles Filles and La Toussuire in le
Tour 2012 were included. The three blue data points for Contador 2009 correspond to
the final climbs on Verbier, La Colombière and Mont Ventoux. Finally the purple data points are the final climbs of
Indurain in his Top-Epo tours.
At first sight we see that with the exception of Indurain the data series are
very well presented by smooth theoretical curves, from which we may learn some
of the hidden secrets.
The Indurain data are all over the place . No theoretical model whatever can
be fitted to these data. The best way to describe this is to state that Indurain
rode at the same high power regardless of the length of the climb. In fat this
means that he had an extremely high maximum aerobic power, but he had no, or
did not need to use, any significant
anaerobic energy. In plain words; due to his unlimited use of Epo he had an extreme aerobic power and
a corresponding VO2max.
The Froome curve lies entirely and far below all Indurain data, thus anyone
claiming that Froome was riding in 2013 at the Indurain level of 1994 should
know better.
First some
words about the theoretical curves. We can consider a cyclist to be a hybrid machine.
He gets energy from aerobic and from anaerobic chemical processes. His aerobic
energy reservoir is virtually unending,
but the intensity at which he can use it is limited by his maximal oxygen
uptake and his maximal aerobic power. Let us name this maximal aerobic power
which can be sustained endlessly as CP
Critical Power. On top of CP he can use some anaerobic power from a limited
reservoir. The best possible climb will be when he throws his anaerobic energy into
the battle in such a way that he is exhausted exactly on the finish line, not
before and no after.
If the
foregoing model is realistic then the highest average power on an all-out climb
can be computed and/or predicted.
Climbing
Power = Critical Power + (Anaerobic Energy)/ Time of the climb
Or in shorthand
; P = CP + AEC/t
I am personally very surprised and pleased that all the real-world data (except
Indurain) could be perfectly well reproduced by this simple formula. Further we
now replace our belly feelings by reliable and undeniable numbers as in the following table.
|
|
Critical Power Watt/kg
|
VO2 at CP ml/min/kg
|
Anaerobic Energy kJ/kg
|
|
Froome 2013
|
5.16
|
67.3
|
1.58
|
|
Contador 2013
|
5.20
|
67.8
|
0.88
|
|
Contador 2009
|
5.42
|
70.7
|
1.81
|
We see that in the Tour 2013 Froome and Contador had the same critical power
(within less than 1%), and the same oxygen
uptake at the CP level. These numbers of CP and VO2 at CP are so low
that we may state beyond any doubt that both riders were clean with regards to Epo-like
products and/or practices. However Contador had a much lower AEC than Froome.
We all saw that Contador indeed lacked the extra anaerobic explosiveness. Unfortunately
almost nothing is known about reasonable numbers for the AEC, nor about
possible drugs or practices to boost AEC.
Because AEC is directly related to the capacity to go beyond the aerobic limit we suppose that this capacity can be
raised by intensive and scientifically targettted training. Is this the real
secret of Froome and his team? Maybe Sky
and Mr. Brailsford may open the box and give us the complete openness he promised
some years ago.
Last but
not least we look at Contador in 2009. His blue curve may even supersede most
of the Indurain points
and there is a gigantic difference between Contador
2009 and 2013. His CP was in 2009 a full 4% higher, and his AEC was even more
than double with respect to 2013.
About Contador in 2009 I have no doubt; doped. About Contador in 2013 ; probably
clean but badly prepared.
|